

Nordic Asia Investment Group - Newsletter July 2023
Dear Investors,
Hope all is well and that the summer holidays have started off well so far.
As we gradually enter the second half of 2023, a couple of key issues might be important to follow and consider ahead of the second half of this year.
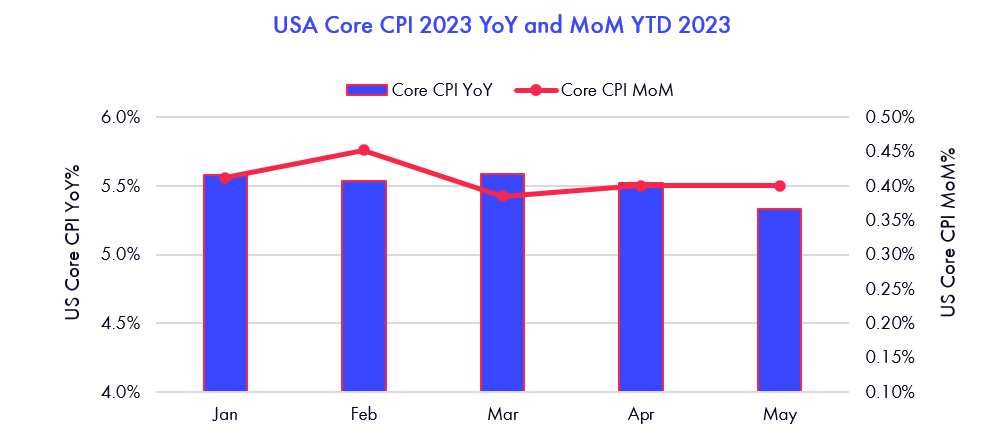
First of all, despite a positive sign of relief in the May (published June) US CPI number and the FED rate pause that followed, in those numbers, especially the core CPI components, still increased on a MoM basis by +0.4%.
By looking into the details of those numbers and analyzing the base effects from core CPI last year, we can see that if core CPI components do not decelerate enough on a MoM basis going forward, unlike energy and commodities during this spring, the base effects from last year’s core CPI are still too low for core CPI to come down significantly on a YoY basis later this fall.
Now, based on the Fed minutes that came out just earlier this week that guided for a more prolonged and possibly higher interest rate environment, this guidance further accelerates a difficult dilemma of either 1. Higher or more prolonged inverted yield curve between the 2 yr vs 10 yr or 2. Longer term interest rates will need to be raised further to match those of short-term rates (i.e. increase in 10-year yields) or a combination of both.
In the first case, a higher or more prolonged inverted yield curve between the 2 yr vs 10 yr might cause more issues like those banking woes we saw earlier this year. In the latter case, if 10-year yields rise further, not only will it increase risk term premia but also cause mortgage rates to rise further, which will contribute to stickier core CPI (+30% of CPI weight is shelter).
Therefore, as we await the next CPI print this week, headline CPI might continue to decline, but the MoM changes on core CPI are more important to focus on for the factors mentioned above.
Now shifting our focus back domestically, the recently published retail sales nr for May 2023 came in at +12.7% overall, slowing down from +18.4% on a YoY basis (due to a low base in April last year), but MoM improved sequentially by 0.42%, and services and retail goods (apparel and jewelry) continued to outperform the broader retail sector. For example, the catering industry rebounded by +35.1% in May, while discretionary apparel and jewelry was up +17.6% and +24.4% in May.
During the June long weekend (dragon boat festival from June 22nd to June 25th), the nr of domestic travelers came in at 106 million passengers, i.e. a growth of +32.3% vs same period in 2022, corresponding to 112.8% of 2019 pre-covid 19 levels, but still, in terms of total tourism revenue, it came in slightly lower than that of pre-covid at 94.9% of 2019 levels and compared to 2022 total tourism revenue still grew by +44.5%. However, the service sector PMI slowed sequentially to 53.9 in June vs 57.1 earlier in May citing softer growth in June vs last month while hiring picked up and business confidence for the year ahead improved in June.
Despite this, market volatility increased during June due to a lack of further policy measures that some market participants had hoped for and a somewhat decelerating recovery trend since mid-April 2023.
Internally, as we are continuing with our concentration strategy during this summer, our focus is not just following the shorter-term recovery trends post-covid-19 (since all foot traffic related measures are well above those of 2019) but rather asking ourselves what level of retail sales growth is reasonable to expect post 2023 covid recovery in the years ahead. Of course, in the longer-term, China’s domestic market is a vast market with tremendous growth potential where the average GDP per person is approx. 12.000 USD vs developed countries such as the US at 60.000 USD per person.
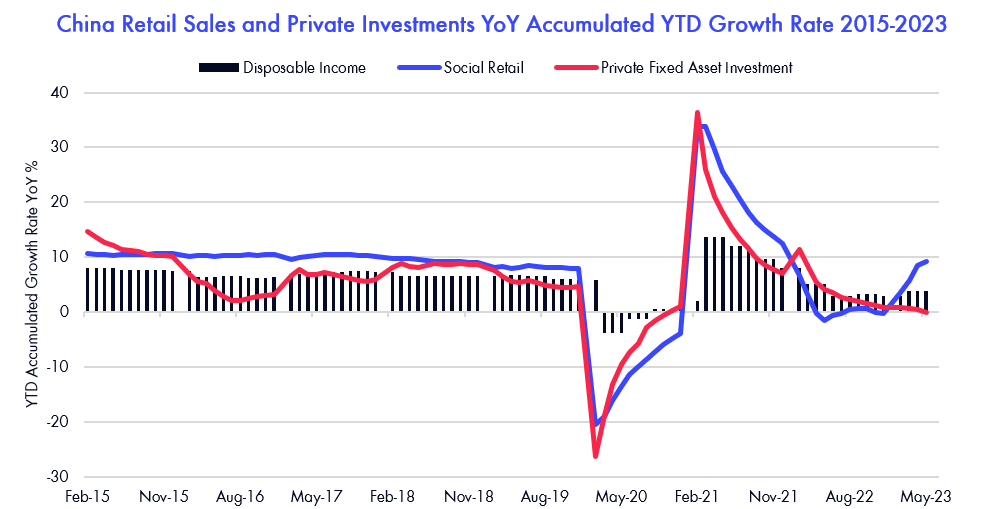
However, in the midterm retail sales growth is highly correlated with disposable income growth, which in turn depends on private sector business profits and its expansion capex cycle. Since the China reform and opening up in 1978, the private sector as % of GDP has grown to 60% of GDP and stands for more than 80% of employment today. Therefore, the domestic economy is highly dependent today on private enterprises and overall improvements of private business outlook. Looking at this in the analysis below shows that the domestic private sector capex cycle has not improved enough into the first Covid-19 recovery period as of YTD May 2023.
The changes in private enterprise capex cycles are driven either by replacement capex or expansion capex, and expansion capex is driven by several factors such as 1. Business confidence / risk appetite (business outlook) 2. Cost of capital / availability of liquidity (investment climate) 3. Profit margin growth / capacity utilization (business profitability).
Currently, some market participants do argue that the current “organic” recovery strategy is not enough or would require unnecessary longer time to restore private sector business confidence to kick off a renewed capex cycle. Therefore, there have been discussions within the politburo around a possible stimulus package to enhance private sector business confidence to fast-forward a broader capex cycle post Covid-19. Although we know the government has a wide range of stimulus tools and a relatively stable domestic government debt to GDP level, we think a possible measure could be to introduce a number of targeted stimulus measures to fast-forward the recovery capex cycle but could spare more broader economic stimulus for later or if the global economic environment becomes more complicated going forward. The next economic politburo meeting will be held towards the end of July, and we will receive more information on that by then.
Looking ahead into the Q2 reporting season, we are expecting strong Q2 results for our portfolio companies due to low base, and our service, and offline retail sector focus, as well as sequential MoM improvements in Q2 vs Q1 2023. Furthermore, despite uncertainties on the pace of organic recovery in the domestic market, our portfolio companies have expanded during covid-19 years and will benefit well during this first year of Covid-19 recovery. However, the key focal point for us in dialog with the portfolio companies will be focused on the outlook and business strategy execution in the years after the first year of post-Covid-19 recovery in 2023.
During the months ahead, we will continue the ongoing portfolio concentration process with the aim to complete this process after this year's Q2 reporting period by the end of this summer.
Thanks again for this and looking forward to having you visiting us later this year.
Best Regards Yining, Jason and the NA Team 7th of July 2023
Trip.com 1Q23 review
Trip.com released a strong 1Q23 result despite the surge of COVID infections in Jan-2023. 1Q23 net revenue was 9.2BCNY, +123.7% YoY, beating consensus by 73.2%, driven by release of pent-up demand. Adjusted EBITDA margin reached an all-time high of 30.7% thanks to strong revenue growth and cost & expense control. Adjusted operating margin was also at the record high of 28.5%, thanks largely to operating leverage improvement. By segment, 1Q23 accommodation reservation revenue was 3.48BCNY, +140% YoY or +15.3% vs. 1Q19 level, driven by 100% YoY growth of domestic hotel bookings and 40% of 1Q19 level of outbound hotel reservations. Ticketing revenue was 4.16BCNY in 1Q23, +149.9% YoY or +23.9% vs. 1Q19. Domestic air booking has already surpassed 1Q19 level while outbound air reservations have also recovered to 40% of 1Q19 level, vs. ~20% of outbound flight capacity recovery.
Trip.com’s strong result was supported by its higher-end customer base, whose consumption power remained relatively unharmed in light of Covid. According to management, the release of pent-up demand is the major driver for Trip.com in 2023 despite the fact that the main app MAU is still 10-20% lower than pre-COVID level and monthly but a higher consumption frequency per user.
Looking ahead, we expect strong momentum throughout 2023 with increased tourism in both domestic and outbound markets. We also expect a strong 2Q23 result for Trip.com supported by a strong Labor Day holiday and Dragon Boat Festival. In 3Q-4Q23, we may see further support from the gradual recovery of the outbound market, offsetting potential weakness in the domestic market. Finally, we believe that Trip.com could secure healthy growth with its rich resources in the global tourism market and best-in-class services among domestic players.
Chow Tai Fook FY23 review
Chow Tai Fook delivered a FY23 (year end 31/03/2023) result of 94 BHKD in sales, -4.3% YoY, missing consensus by 7.2%. FY23 mainland retail sales value (RSV) declined by 13% YoY due mainly to COVID disruption. Net profit was 5.4BHKD (NPM: 5.7%) in FY23 down -19.8%. Gross margin was 22.4% in FY23, -0.2ppt YoY due mainly to unrealized loss of gold loans, as the gold price hiked. Adjusted gross margin improved by 0.3ppts YoY to 23.7% thanks mainly to higher gold price and a contracted retail discount. As a result, core operating profit margin was flat at 10% due to slight operating deleveraging in FY23. FY23 mainland retail was the main drag, with revenue at 37.2BHKD, -15% YoY, despite 206 retail stores net opening (Mainland retail POS +18.2% YoY in FY23). Mainland wholesale was weak in FY23 with revenue at 44.4BHKD, +2.9% YoY due to Covid-19 disruptions during 2022. However the nr franchised stores expanded quickly by 1,346 up +32.6% during FY23.
During the result release, management re-iterated their branding up strategy while also opening more self-operated stores in the upcoming years but slowing down the pace of franchise store openings that grew from 3.429 to 7.269 retail stores during covid-19 years 2020 - 2022. Furthermore, the company aims during this year to upgrade its brand premiumization strategy to their enhance brand / product / experience differentiation vis a vis other mainland competitors who focus more heavily on price and discount promotions. This might affect their performance vis-à-vis their peers in the short term, but improve group profitability, brand differentiation vs local mainland peers.
The company also reiterated its current run rate RSV (Retail sales value) growth of +38.1% in April and May and SSG in its own operated stores increased by +16.8% in its mainland operations and +61.3% in their HK & Macau operations following the reopening since 2023 but also observed a softening of SSG in June.
Jiu Mao Jiu operation update
According to Jiu Mao Jiu’s release, its core brand Tai Er recorded 91-92% same store sales recovery vs. 2019 same period in the first two months of 2023 while 80% and 84% for March and April, weakened from Spring Festival. Then SSS recovery rebounded to 89% in Labor’s Day but fell quickly to only 80% for full month of May partly due to COVID resurgence and softer growth pace in May. During the Dragon Boat Festival, Tai Er also recorded an 90% SS recovery vs. same period in 2019, a similar recovery level as the Spring Festival and Labor’s Day.
The companies new brand Song, started in 2020, was also in a recovery trend, with April and May same store sales at 128% and 105% compared to the same period in 2019, respectively. In terms of store expansion level, Tai Er cumulatively expanded 31 stores by May 2023, while Song expanded 13 stores. For the full year we expect new stores expansions of Tai E brand to add +100 stores and Song to add +20 stores and same store sale to range within 85% – 90% of 2019 pre-covid levels.
However, Song’s development is faster than expected, with a store expansions of 30-40 by the end of 2023. Thus, we maintain our constructive view of Jiu Mao Jiu's solid management and the rate of new store for Tai Er will expand more rapidly during H2 2023.
Hygeia Healthcare Holdings
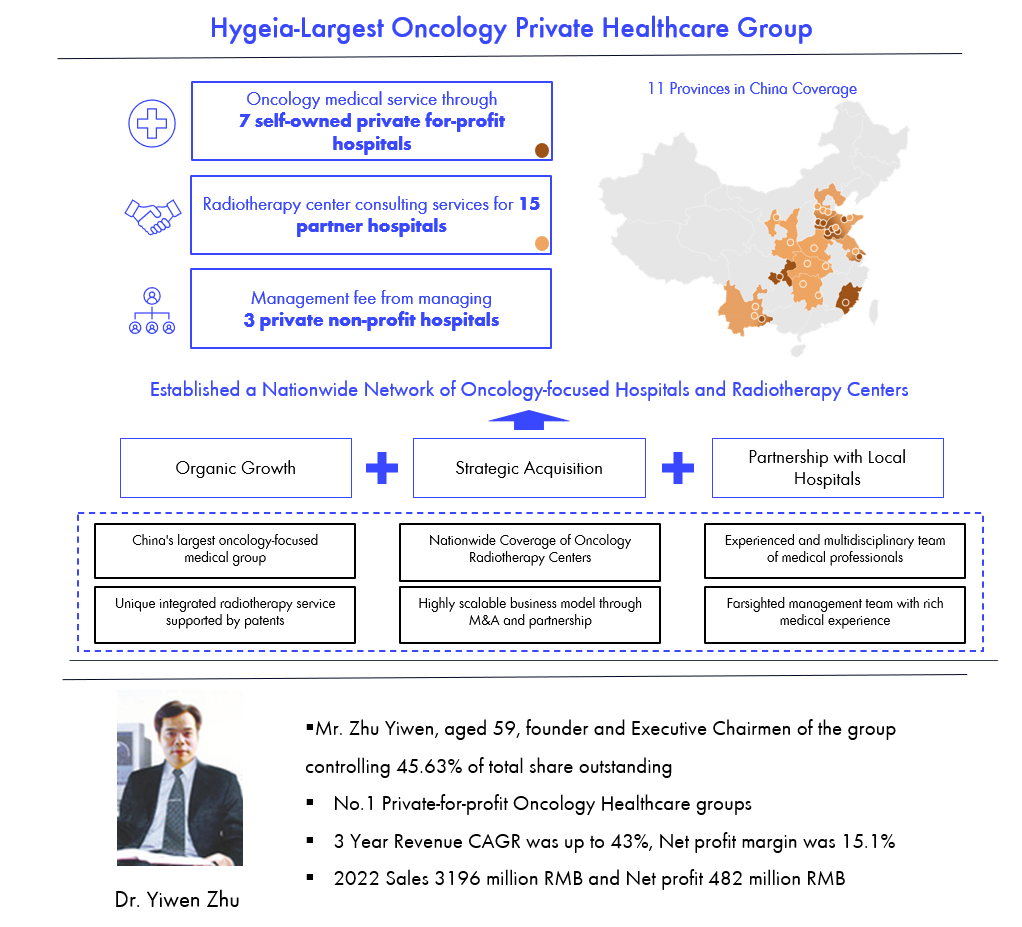
Hygeia Healthcare is the largest oncology healthcare group in China, focusing on radiotherapy-related private healthcare services to accommodate the accumulating demand of oncology patients in China especially in lower tier cities.
Although public healthcare institutions dominate the oncology market, China private oncology treatment market in China is expanding at a faster growth rate since the prevailing supply of oncology treatment resources cannot meet the increasing needs of oncology patients, especially in low tier cities. Currently, the number of oncology patients is approx. 4.6 million per year, and it is estimated to grow to around 6 million in the coming years. However, the majority of oncology patients live in tier 3 or below cities, where the penetration of hospital beds per oncology patient is lower than in tier 1 or 2 cities. Overall, private sector oncology healthcare is expected to more than double its current share of the total patient treatments in China over the longer term, where the use of radiotherapy oncology treatment is expected to grow faster than other treatment methods since most oncology diseases are required to use radiotherapy treatment as part of therapy, but only 23% of patients use the radiotherapy as a treatment method in China, vs around 60% in the U.S.
Hygeia Healthcare is currently the largest private oncology healthcare group (but holds only 2% market share of the private oncology healthcare market) focused on providing a high quality oncology radiotherapy treatment in the lower tier cities in China. Currently, Hygeia is expanding their hospital landscape through a combination of organic growth, strategic acquisitions, and cooperation with hospital partners. Hygeia operated or managed a network of 13 hospitals, of which 4 are self-built, 8 acquired hospitals and one externally managed hospital. In 2022, Hygeia revenue was 3.2 billion RMB and grew by +40% YoY, driven by increasing patient visits in both existing hospitals and newly acquired hospitals. In the coming years, Hyegia aims to acquire 1-2 hospitals per year and self-build 1-2 hospitals annually to reach a revenue growth at +30% per year and grow its current nr of hospital beds from +4.400 to +12.000 in the coming years.
Hygeia core strengths are their efficient management and unique market position. The construction period of Hygeia’s self-built hospitals takes around 25 months (vs 36–48 months on on average) with a profit break even time within 1 year. In terms of acquired hospitals, Hygeia has a proven record of enhancing the operational efficiency of its acquired private hospitals and improving their net profit margins from single digits to group level profits in 1-2 years post-acquisition. Thereby, Hygeia Healthcare is well positioned to capture the growth of private specialized healthcare service consumption, especially in the lower tier cities of China.
Disclaimer
This e-mail is for marketing purposes only and does not constitute financial advice to buy or sell any financial instrument. This e-mail and the documents within may not be distributed further and is only for people and companies' resident in the European Union, the EES and Switzerland. This e-mail is therefore not intended for any person or company resident in the United States, Canada, Japan or Australia or in any other country in which the publication of this material is forbidden. If the laws and regulations is as described above, the reader is then prohibited to take part of this –mail. In accessing this e-mail the reader confirms that he or she is aware of the circumstances and requirements that exist in respect of accessing this e-mail and that these have not been violated. Nordic Asia disclaims any responsibility for any typos and do not guarantee the validity in the information and documents in this mail including typos, corrupt e-mails and/or for actions taken as a result of the mail and/or the documents within. All investments is always attached to a risk and every decision is taken independently and on their own responsibility. The information is this mail is not intended to be used instead of the professional financial advises as the individual receiver might need. There is no guarantees that the Company will fulfil its obligations under the loan financing which is referred to in this e-mail. Any funds invested may be lost.