

Nordic Asia Investment Group - Newsletter June 2023
Dear Investors,
Hope all is well in recently as the summer is approaching shortly,
Despite the warmer weather, the month of May was quite turbulent from multiple points of view.
Starting from a global perspective one of the most significant events that occurred in the current inflationary cycle actually occurred in Sweden. As we described quite in depth in our march newsletter the effects of the “inverted yields” caused by the unprecedented QE period have led to lower yields on the long-term investments while borrowing costs (short end of the curve) are on the rise due to inflationary pressure. Therefore, similar to a bank, any financial institution including property developers that purchased assets at historical low direct yields pre-2022 are now facing the dilemma of negative interest rate margins and deterioration of their interest coverage ratios. The downgrade of SBB (Samhallsbyggnadsbolaget) credit rating to sub-investment grade level caused a rapid decline in its bond prices and inversely an sharp increase in its implied borrowing costs. Thereby towards mid May its assets yielded an implied approx. 3.5% direct yield vs an 13.4% implied lending costs on senior unsecured bonds.
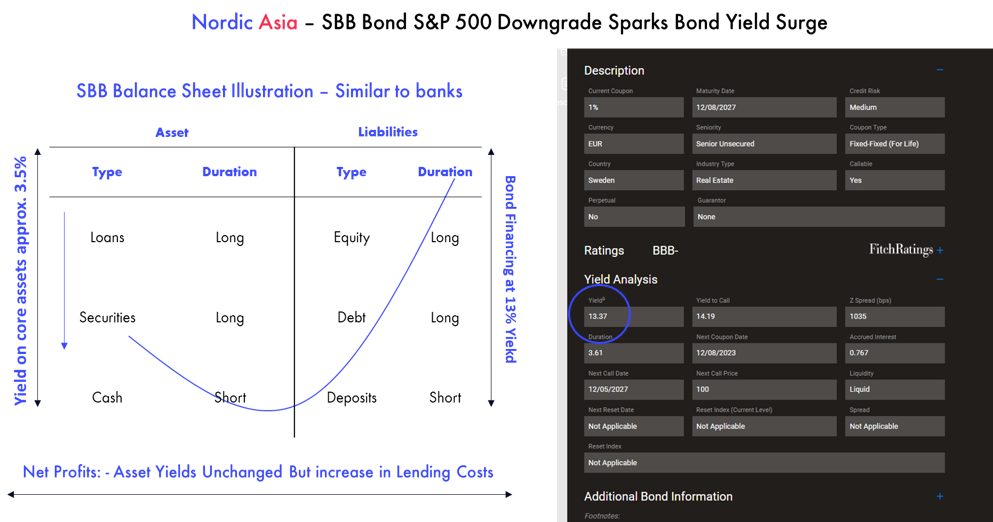
Although the situation stabilized towards the end of the month. The underlying problem of inverted yields on longer duration assets that yield less than shorter term borrowing cost still persists. As we wrote earlier about the SVB event in march 2023, if inflation overshoots later this year, then more “skeletons” like those of SVB and / or SBB might resurface again towards the latter part of this year.
Therefore, the nr 1 question to study and analyze to assist investment decisions in 2023, really depends on the inflationary outlook and investors fundamental view on inflation. Looking at the recent data, we see that core inflation in the US is still increasing by 0.4% MoM basis and 5.5% YoY while the headline CPI came in at a lower number of 4.9% YoY in its latest April CPI report published in May. The key reason for the gap of 5.5% core inflation vs headline 4.9% inflation is mainly due to the high comparison base of commodity and energy prices during this period last year (i.e. Q2 2022).
Therefore, the more significant risk is not the upcoming couple of CPI reports (since comparison base is still high from last year) but the CPI reports to be published towards Oct - Dec 2023 i.e. when the base effects of the high commodity and energy prices from Q2 2022 fades away. Therefore, if core inflation does not slow down significantly on a sequential basis in the upcoming CPI reports then, due to reduced commodities price bases from last year, the current falling trend of headline CPI might change and turn up again towards end of year. If this happens, then it could trigger a renewed market pricing of duration risks and push yields higher across the yield curve in a slower economic environment (i.e. possible stagflation environment). Therefore, the upcoming trends of core inflation development on on a sequential (MoM) basis basis will be essential clues to the development of inflationary outlooks towards the later part of this year.
Similarly in the past month and since mid-April a series of news and some macro data points slightly weaker than expected put a lid on the China “Reopening” investment theme. However, let us break down some of those headlines and data points more in detail.
First of all the key retail sales datapoint in April (published in May) came in at +18% YoY and +0.49% MoM in April vs March. Although it did come in a bit below economist consensus at +21%, the underlying structure of the retail sales still showed strong recovery momentum, for example the catering industry grew +43% YoY, discretionary apparel +32% and jewelry products increased by +44.7%. Furthermore, despite China official manufacturing PMI showed a slowdown in May PMI 48.8 vs April PMI 49.2 and service PMI came in at 54.5 vs 56.4 the private sector Caixin Manufacturing PMI showed a rise in PMI to 50.9 vs (49.5) and services rebounded to 57.1 (56.4) in May. Caixin surveys more SME and privately owned enterprises, while the official PMI has a larger sample number but more larger firms and are more skewed towards SOEs, therefore the difference on the official PMI vs Caixin PMI can partly be explained by survey sample of more private and SME for Caixin PMI vs larger firms and SOEs for the official PMI. However, retail sales in April did come in lower than consensus but to say the economy is slowing down and rebound is losing steam might be a bit overdone. May China CPI came in at +0.2% and with a +18% retail sales growth YoY if compared to the other countries retail sales number and especially when comparing inflation adjusted real value is on a clear improving and converging trend.
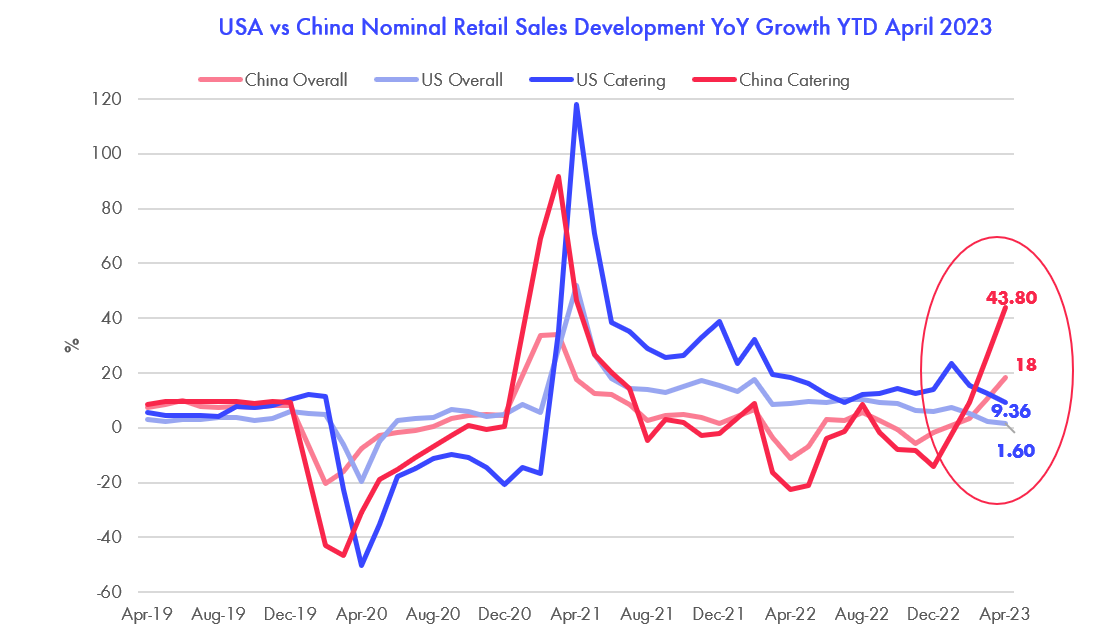
While it is up to the market to decide if the number is ”good” or “bad” our view is at least that the recovery is proceeding on track and our strategic focus to increase allocations to the service sector and domestic consumption rebound in discretionary items is recovering well above that of general retail sales and smaller private companies are more upbeat and recovering better than those of the larger companies or SOEs.
However, the Hong-Kong market stock market has trended down in the short term due a mix of debt limit, geopolitical concerns and lower than market expected macro data since mid April. But under the “hood” the recovery trend at sector and company level and earnings growth through operating leverage is continuing in a positive direction. Therefore, the underlying trend to unlock the long-term potential of China's consumption and service market is continuing its recovery path and more market friendly policies are gradually being introduced to further enhance domestic consumer confidence and boost consumer enthusiasm.
Therefore, during this process we have continued to concentrate our portfolio now down to sixteen holdings. This is a gradual process that we aim to continue in the months ahead and increase our concentration towards more niche consumer companies with strong long-term growth fundamentals that are benefiting from the continued recovery in China.
Thanks again for this and looking forward to having you visiting us later this year.
Best Regards Yining, Jason and the NA Team 9th of June 2023
Meituan 1Q23 review
Meituan reported a beating result with 1Q23 revenue at 58.6BCNY (+26.7% YoY, -2.5% QoQ) while adj. net profit at 5.5BCNY (adj. NPM: 9.4%). Gross margin in 1Q23 was 33.8% improved by 10.6ppts YoY thanks mainly to the cost saving from the abundant rider supply in light of mounting unemployment in China. S&M expenses grew by 14.5% YoY due to increased users subsidy. However, S&M% declined by 1.9ppts on operating leverage improvement. Both R&D% and G&A% also declined by 1.8ppts and 1.5ppts YoY respectively. Adj. EBITDA was 6.26BCNY in 1Q23 with improved margin at 10.6% (vs. 4.9% in 4Q22). Segmentally, core local commerce achieved 42.9BCNY revenue in 1Q23, +25.5% YoY, with operating profit of 9.4BCNY (OPM: 22%, +8.3ppts YoY). The strong result was driven by 1) rider costs saving, 2) rebound of offline consumptions, and 3) 500 MCNY unused subsidy budget in 1Q23. Management reiterated initiatives of market share gaining via user subsidies and merchant incentives during 2Q23-4Q23 to grow market share and fend off competition from Douyin. The operating margin of In-Store, Hotel and Travel businesses will hence be lower in the coming quarters. For New initiatives, 1Q23 revenue was 15.7BCNY, +30.1% YoY, with narrowing operating loss of 5.0BCNY (vs. 8.5BCNY loss in 1Q22) from mainly the community group buying businesses. We believe that Meituan is on the right trajectory with the food delivery business becoming a sticker consumption habit, while In-store service segment is rebounding well and New Initiatives (community group buying businesses ) improving its per unit profit structure.
We like Meituan’s solid market position in local consumer services and extensive food delivery network. Meituan should be able to further benefit from the overall consumption recovery and leverage its market leadership position. Hence, we believe that Meituan could at least achieve strong revenue growth and operating leverage improvement in 2023 despite increased competition from Douyin (Tik Tok of China).
H World Group 1Q23 review
H World Group released an in-line 1Q23 result with revenue at 4.5BCNY (+67.1% YoY) beating the guidance of 61-65% YoY growth, thanks mainly to strong domestic business. 1Q23 adj. net profit was 1.0BCNY, vs. loss of 662MCNY in 1Q22. The strong bottom-line was driven by one-time other income of 514MCNY from the sales of all the holdings of Accor. 1Q23 hotel operating expenses was 3.25BCNY, at 113.1% of revenue (vs. 140% in 4Q22 or 171.3% in 1Q22), indicating a margin improvement along with the overall market recovery. G&A% and S&M% declined by 7.4ppts and 0.2ppts YoY, thanks to operating leverage improvement as we expected. Legacy Huazhu 1Q23 revenue grew by 58.4% YoY vs. guidance of 53-57% YoY growth driven by strong ADR growth of 23.7% YoY (125.3% of 1Q19 level). OCC was 75.6% for Legacy Huazhu that equivalent to 93.8% of 1Q19 level due to the demand gap of business travel. Legacy DH also recorded a strong revenue growth of 118.2% YoY in 1Q23 thanks to improvement in both ADR (+15.6% YoY) and OCC (+15.5ppts YoY). 1Q23 adjusted EBITDA of Legacy DH was -79MCNY vs. -240MCNY in 1Q22.
In 1Q23, H World Group added net 49 hotels domestically. Management maintained their guidance of full year 110-115% RevPAR recovery vs. 2019 level while continue to grow with more than ~800 hotel net new openings in 2023. Furthermore, management guided that there is still room for recovery of the business travel segment vs 2019. Looking ahead, H World Group will continue its strategic focuses of lower-tier penetration and expansion of upper scale hotel brands, which should gradually drive up the ADR in the longer term. In 2023, we believe that H World Group could delivery a solid result given its strong product/brand portfolio, strong management team and better-than-peers customer relationship system in this niche market.
KE Holding 1Q23 review
Ke Holdings (BEKE) released a strong 1Q23 result that with revenue at 20.3BCNY, +61.6% YoY while adj. net profit at 3.56BCNY (NPM: 17.5%) vs. -618MCNY loss in 1Q22. 1Q23 GTV was 972BCNY, +65.8% YoY beating market of 51.2% YoY growth driven by exceptionally strong Existing Home (second hand residential property sale) GTV of 664BCNY, +77.6% YoY, and New Home GTV of 278BCNY, +44.2% YoY (vs. 7.1% growth of NBS figure). Such strong GTV growth was driven mainly by release of pent-up demand and ease of regulation. BEKE also achieved margin expansion with 1Q23 gross margin at 31.3%, vs. 17.1% in 1Q22 thanks to contribution margin improvement in all segments as percentage of fixed costs declined. Adj. EBITDA in 1Q23 also improved to 22.8% (a record high level).
We believe that BEKE’s outperforming market result amid the recovery cycle was due to the company’s effort in gaining market share during the past downcycle. Those effort include 1) retaining agents, 2) gaining customers’ trust with quality services, 3) training to agents and stores owners, 4) performing detailed analysis region by region in helping store level operation, and 5) developing home renovation services. As a result, BEKE was able to capture the reopening opportunity and achieve the strong market share expansion in 1Q23. However, due to BEKE’s business model (i.e. receives commission on first and second hand estate market sales transactions), it is prone to residential market transaction cyclicality. We see that BEKE should be able the maintain a relatively strong growth in 2023 thanks to not only low base and general recovery but also the company’s solid brand name and quality services as well as its solid market leadership position. Although longer-term new-residential construction starts is likely to remain sluggish, transactions in the second-hand property market (i.e. Existing homes) and the renovation market remains a vast attractive market in China.
Disclaimer
This e-mail is for marketing purposes only and does not constitute financial advice to buy or sell any financial instrument. This e-mail and the documents within may not be distributed further and is only for people and companies' resident in the European Union, the EES and Switzerland. This e-mail is therefore not intended for any person or company resident in the United States, Canada, Japan or Australia or in any other country in which the publication of this material is forbidden. If the laws and regulations is as described above, the reader is then prohibited to take part of this –mail. In accessing this e-mail the reader confirms that he or she is aware of the circumstances and requirements that exist in respect of accessing this e-mail and that these have not been violated. Nordic Asia disclaims any responsibility for any typos and do not guarantee the validity in the information and documents in this mail including typos, corrupt e-mails and/or for actions taken as a result of the mail and/or the documents within. All investments is always attached to a risk and every decision is taken independently and on their own responsibility. The information is this mail is not intended to be used instead of the professional financial advises as the individual receiver might need. There is no guarantees that the Company will fulfil its obligations under the loan financing which is referred to in this e-mail. Any funds invested may be lost.