

Nordic Asia Investment Group - Newsletter March 2023
Dear Investors,
Hope all is well,
This march marked a significant “turning point / milestone” in the currently complex market environment, marked by the rapid development of SVB bank failure and related subsequent events. Although there are specific idiosyncratic issues and risk management inadequacy at case-by-case level, they also do share some commonalities related to the previous central bank balance sheet expansion cycle.
The basic nature of banks business models is to borrow at short durations with lower interest rates and lend out for longer durations at a higher interest rate. I.e. the old classic 3-6-3 banking analogy (Borrow at 3% deposit rate, lend out for 6% and then play golf at 3.00 pm). However, due to the lengthy period of QE expansion, QE itself suppressed longer term yields while reducing the slope of the yield curves. However, as inflationary pressure took hold from 2021 onwards, the short-term interest rates had to go up to combat inflation causing a yield curve inversion since early 2022.
On one hand, market participants see yield inversion as an early sign of economic recession, on the other hand an inverted yield curve also implies a possible negative interest margin for the banking sector since their borrowing costs (short term duration) becomes more expensive vs the yields received on their loan book (long term duration). Therefore, in the likes of the banking issues earlier this march, if these banks had valued their loan book or investment securities at current fair value, they would need to take a haircut on these loan assets due to the current inflationary environment vis-à-vis those issuances before the start of the current rate hike cycle.
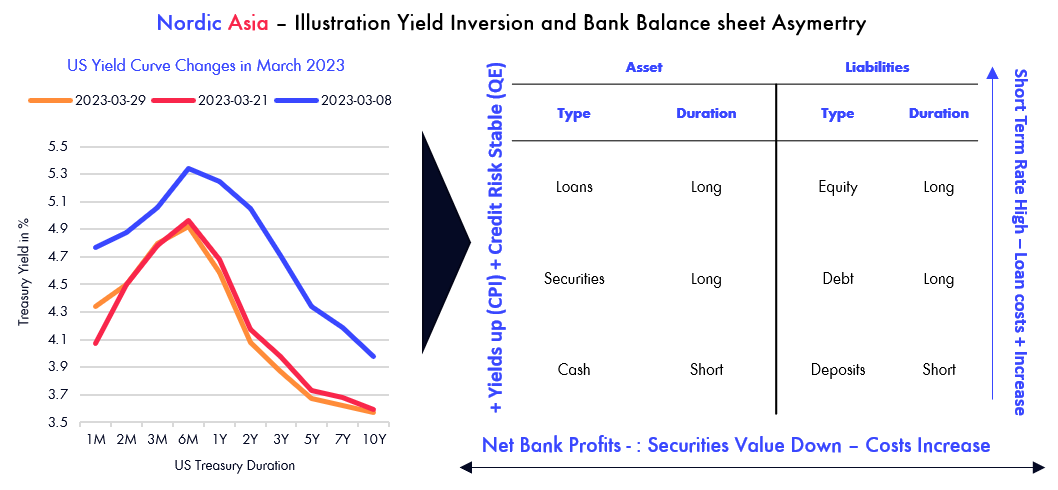
Therefore, due to this the Federal Reserve had to step into the market to perform some sorts of “Non QE-QE” via further expansion of its balance sheet and to offer US banks the BTFP program in which banks can use treasury as collateral value on par (i.e. at cost not at fair value) to intervene and stabilize the market. Although this was necessary given the potential contagion effects, the core problem of inflationary pressure remains. Therefore, as we put the month of march in the “books” for now, it is still important to be reminded of the systematic cause of the banking turbulence in March 2023 and if inflation overshoots later this year then the “skeletons in the closet” might resurface again.
In the past month, various economic indicators in China's domestic consumption sector have shown strong resilience, basically confirming that the Chinese economy has started a new round of growth after the epidemic in the past years. However, a high inflationary / interest rate environment will continue to dampen external demand and economic fundamentals in export markets. Therefore, our focus centered on the strategic recovery of domestic consumption in China and avoiding the export sector should be beneficial in this environment.
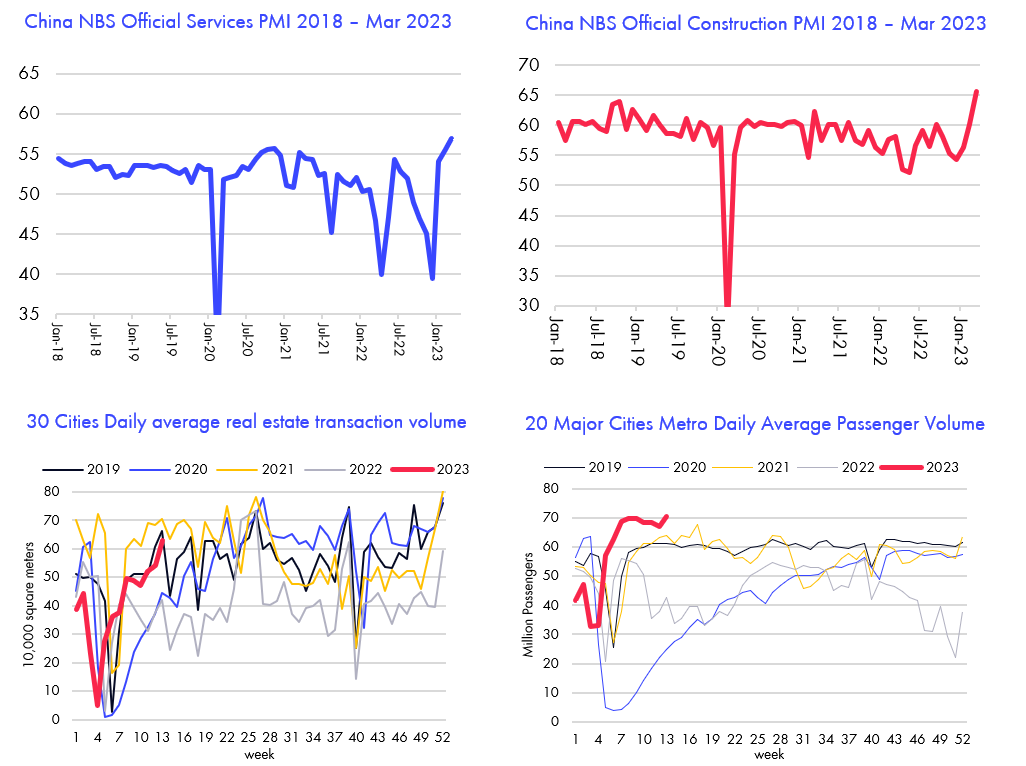
Domestically in China, the reopening momentum continued and most offline traffic high-frequency data sets show a rebound on or above the levels back in 2019. Traveling restrictions were all eased and mask bans were lifted in HK and Macau and further loosened in mainland China. The previous, Covid-19 era from 2020 to 2022 is seemingly coming to an end. Therefore, although manufacturing PMI (approx. 30% of China economy) came in at 51.9 partially due to slowing exports, the domestic non-manufacturing PMI (service and construction) rose to new highs at 58.2 and 65.6 respectively. The daily average transaction area of the 30 major and medium-sized cities in the real estate industry in March was 531.000 square meters, higher than the 281.000 and 402.000 square meters from January to February this year, with first tier cities reaching a 22-month-high year-on-year. The second-hand housing transactions in major first and second tier cities have also rebounded significantly. For example, in March, the second-hand housing transactions in Beijing increased by 30% month on month and 30% year-on-year, reaching a new 24-month-high.
Despite Q4 results were quite in-line with the general state of the economy during that time last year, during calls with our portfolio companies in March the business updates so far in Q1 is quite strong especially for those companies with greater exposure towards the service and offline retailing sector pointing to pent-up demands and post-pandemic supply-demand gaps. For example, Huazhu Hotel group (largest private owned hotel chain in China) reported a RevPAR (revenue per available room) of 140% in Feb 2023 vs 2019 pre-covid RevPAR levels) a full year 110% RevPAR guidance vs 2019 and a Q1 2023 revenue guidance of +61%-+65% top line growth. Since the Chinese hotel market is vastly fragmented, Huazhu today’s commands only approx. 4-5% of total China hotel industry market share. Similar recovery to levels of 2019 can be seen in other service and offline retailing sectors such as food & beverage, leisure, catering etc. Therefore, as we start to head into the Q1 reporting season in April, May we should start to see quite favorable results from our portfolio companies not only on top line recovery but also bottom line growth due to operating leverage and reduction of some Covid-19 related one off costs (e.g. franchise subsidies, extra staff costs, temporary factory suspensions etc.).
In Nordic Asia and since the beginning of this year, we’ve continued to increase our portfolio concentration towards more niche discretionary consumption targets with extra emphasis on the offline retail and service sectors as well as the secondary real-estate renovation market segment. Previously, due to uncertain changes in the Covid-19 flare-ups and policy announcement, it was difficult for us to be as concentrated as we would’ve wanted. But from this year onwards, we’ll continue to further concentrate our portfolio in these niche domestic consumption brands, operating in a yet vastly fragmented marketplace with the potential to further consolidate their market shares. This process is well underway, but it is a steady and gradual concentration process during the year. Therefore, despite continued external uncertainties, we will continue to focus on our niche discretionary consumption market recovery and prepare ourselves to take advantage of possible greater market volatility later this year.
Again many thanks in advance for your partnership with us in NA - Best Regards Yining, Jason and the NA Team
Anta Sports 2H22 review and 2023 outlook
Anta Sports reported beating 2H22 result. Revenue was 27.7BCNY, +4.4% YoY, while net profit at 4.0BCNY, +3.1% YoY. Net margin was flat YoY at 14.5%. Gross margin declined by 1.8ppt YoY to 58.5%, while operating margin improved by 0.4ppt as the group proactively contained marketing expenses under the weak consumption environment in second half of 2022. In 2H 2022, Anta brand achieved 14.4BCNY revenue, +6.9% YoY and 3.0BCNY operating profit, +10.6% YoY, thanks mainly to expenses control and ASP increase. Anta brand’s DTC (direct to consumer) revenue grew by 45.3% YoY on further DTC transformation while online sales revenue grew by only 10.8% YoY. Number of DTC stores conversion reached 7,200 of 9,603 total stores by year end . FILA achieved 10.7BCNY revenue in 2H22 , -2.3% YoY, and14.6% YoY decline in operating profit due to operating deleverage and discount in 4Q22. Store number of FILA declined to 1,984 as the group further closed underperforming stores. Other brands remained strong with 23.5% YoY revenue growth. Both Descente and Koolon grew by +26% YoY as the brands are trending up. Operating profit of other brands grew by 46.7% YoY thanks mainly to economics of scale.
However, offline retail recovery in 2023 is well underway and for the first two months of 2023, management indicated pleasant progress of positive retail growth (on high base) and improved channel inventory to for both Anta and FILA. We expect a recovery of same store sales for the group in 2023 with FILA leading the growth recovery as the most impacted brand by COVID in 2022. Operating margin is also expected to rebound to 2021 level (22.3%) thanks mainly to operating leverage improvement. Anta Sports will also continue its brand upgrade for Anta brand, which could drive up the ASP during this year. We expect Anta Sports to deliver a solid result in 2023 as top domestic sportswear group under the recovering consumption environment in China.
Meituan 4Q22 review and 2023 outlook
Meituan reported 4Q22 result with revenue at 60.1BCNY (+21.4% YoY) and adj. net profit at 829MCNY (adj. NPM 1.4%). Adj. EBITDA margin improved to 4.9% as Meituan continued its cost and expenses optimization amid the weak market. Marketing expenses declined by 5% YoY in absolute amount, or down 4.9ppts YoY as % of revenue as Meituan restrained its promotion and advertisement. Revenue of core local commerce segment was 43.5BCNY, +17.4% YoY thanks to surging demand of on-demand services. On-demand delivery orders grew by 13.6% YoY, among which Instashopping order volume grew by 74.9% YoY. In-store, hotel and travel (ISHT) was severely impacted by COVID with decline similar to 2Q22 (Shanghai lockdown). Operating profit of core local commerce was 7.2BCNY (OPM 16.6%, +2.8ppts YoY). New Initiatives segment achieved16.7BCNY revenue, +33.4% YoY, and operating loss of 6.4BCNY, better than expectation. Meituan Select improved efficiency by notably increasing GTV contribution from centralized procurement. Meituan Grocery also recorded robust growth, with 128% YoY growth in GTV and 76.1% YoY growth in order volume. On the operation level, we saw uninspiring performance as a combined result of COVID and high user-end penetration. Number of transaction users (LTM) was 677.9mn, -1.8% YoY, while number of active merchants (LTM) was 9.3mn, +5.7% YoY vs. 12% YoY growth in 3Q22 due to COVID resurgence.
We expect Meituan to achieve strong growth in 2023 in-line with the rebound of the overall service industry in China. Management indicated that Meituan’s growth recovery started in March which is earlier than our previous expectation. We also see that operating margin of the delivery businesses will continue to improve in 2023 due to operating leverage and limited cost pressure in 2023. However, we do also expect competition in the In-store, hotel and travel sector (OTA business model) to increase in 2023 as the industry recovers and Douyin (Tiktok) of China is expanding its footprint in this sector. Therefore, further user promotions and short-form video investments to compete in this space will negative effect gross margin in this year while top-line growth is expected to rebound well in 2023 for this high profitable segment at +40% operating margin.
Trip.com 4Q22 review and 2023 outlook
Trip.com released a beating 4Q22 result despite the COVID disruption. Net revenue in Q4 2022 was 5.0BCNY , +7.4% YoY and adj. net profit was 498MCNY, +61.2% YoY with NPM improved by 3.3ppts YoY. Adj. EBITDA margin was 5.7% (+4.5ppts YoY) thanks to cost and expenses control. Trip.com largely cut down the R&D% and S&M% in lights of COVID restriction. At the segmental level, Accommodation reservation revenue was 1.69BCNY, -12% YoY, as 56.9% of 4Q19. Domestic hotel booking weakened QoQ while booking via international platform was better than pre-COVID level, indicating strong oversea recovery. Ticketing revenue was 2.2BCNY, +45.4% YoY, as 63.5% of 4Q19. Strong growth of Ticketing segment was driven by low-base and recovery of international flight booking (incl. outbound) in Dec-2022 (China reopen). Trip.com recorded a strong recovery pace that outbound flight booking and hotel booking +200% and +140% YoY respectively in 4Q22.
Furthermore, In the first two months of 2023, Trip.com outpaced market with 300% YoY growth of outbound travel booking (40% of pre-COVID level), while only 15-20% of outbound flight capacity recovery to pre-COVID level. Management also indicated 80% YoY growth of international business for the first two month. We believe that Trip.com to enjoy a strong momentum in 2023 from the release of pent-up tourism demand and consolidation of market shares during the difficult Covid-19 years in this segment.
CATL
CATL released its financial results for 4Q 2022 with revenue at 118.25 BCNY, +107.48% YoY and net profit was 13.82 BCNY, +58.62% YoY. Gross margin of 22.57% and net margin of 11.69%. The SG&A and R&D expenses accounted for 5.6% and 4.2% of revenue compared to 5.1% and 5.4% from 4Q 21. In 4Q, CATL's shipments were expected to exceed 100GW, and its market share in China's power battery market is close to 50%.
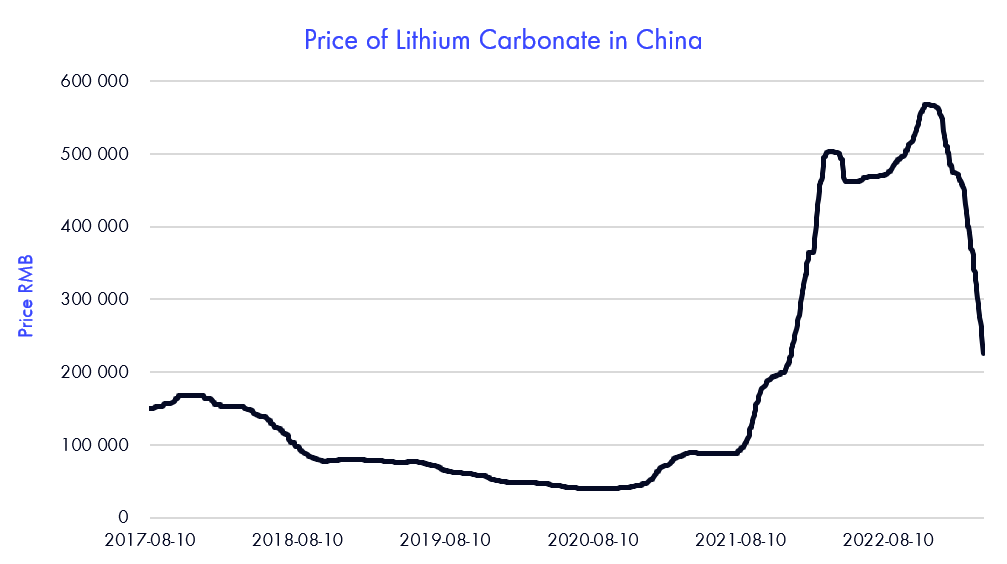
The price of lithium carbonate dropped rapidly in 2023. At the beginning of 2023, the price of battery-grade lithium carbonate was 510,000 yuan per ton, while by the end of March, the price had dropped to 238,000 yuan per ton, a drop of more than 50%. This is mainly due to the fact that Q1 is the traditional off-season, and the sales of NEV (new energy-vehicles) are coming slightly lower than expected due thus far, resulting in an imbalance between supply and demand of lithium carbonate. Due to the rapid decline, the price has not yet been fully transmitted to the rest of the value chain. The current decline in lithium battery prices towards end customers is slower than that of raw materials. Therefore, part of the profits are likely to be retained by lithium battery manufacturers. As the leading lithium battery manufacture in China, CATL has stronger bargaining power vis a vis its customer and its gross margins is likely to benefit from a price / cost dislocation in the coming quarters.
Looking forward to 2023, China's NEV market will still maintain high growth. Due to the better performance of NEVs in terms of power performance, intelligent driving, and cost per unit mileage, consumers' purchase behavior for NEVs is changing from policy-driven to demand-driven. The penetration rate of NEV of new car sales in China will remain well above +30% and continue to support the market demand for lithium battery sector.
SF Holding
SF Holding released its financial results for 4Q 2022 with revenue at 68.34 BCNY, -4.18% YoY and net profit was 1.49 BCNY, -43.81% YoY due weak overall consumer market in Q4 2022. Gross margin of 12.71% and net margin of 2.18%. The SG&A expenses accounted for 7.1% of revenue compared to 8.0% from 4Q 21.
Looking forward to 2023, the impact of Covid 19 will weaken, and social and economic activities will resume active. Under the macro policy to stimulate domestic consumption and promote economic development, it is expected that the industry growth rate will recover in 2023. The YoY growth rate of the express delivery industry will reach double digits in 2023, and SF Express, as the industry leader, is expected to achieve a higher growth rate by virtue of higher quality services and differentiated layout.
In 2023, SF Holding will pay attention to the coordinated development of both volume and profitability. In terms of express delivery volume, consolidate the competitive advantages of original products and services, and at the same time develop new incremental points such as return express, SF Holding aims to achieve double-digit growth. In terms of profitability, SF Holding will ensure that the company maintains a healthy profit level by reducing costs and increasing efficiency, and multi-network integration. As a direct beneficiary target after the epidemic is released, we believe that SF Holding will have a significant YoY improvement in both revenue and net profit margin as parcel volumes recovers in 2023.
Disclaimer
This e-mail is for marketing purposes only and does not constitute financial advice to buy or sell any financial instrument. This e-mail and the documents within may not be distributed further and is only for people and companies' resident in the European Union, the EES and Switzerland. This e-mail is therefore not intended for any person or company resident in the United States, Canada, Japan or Australia or in any other country in which the publication of this material is forbidden. If the laws and regulations is as described above, the reader is then prohibited to take part of this –mail. In accessing this e-mail the reader confirms that he or she is aware of the circumstances and requirements that exist in respect of accessing this e-mail and that these have not been violated. Nordic Asia disclaims any responsibility for any typos and do not guarantee the validity in the information and documents in this mail including typos, corrupt e-mails and/or for actions taken as a result of the mail and/or the documents within. All investments is always attached to a risk and every decision is taken independently and on their own responsibility. The information is this mail is not intended to be used instead of the professional financial advises as the individual receiver might need. There is no guarantees that the Company will fulfil its obligations under the loan financing which is referred to in this e-mail. Any funds invested may be lost.