

Nordic Asia Investment Group - Newsletter September 2023
Dear Investors,
Hope all is well in the month of August.
First of all, starting off from a global perspective, the recent rebound of the WTI Oil price back to around 85-87 USD per barrel implies at this time of writing an increase of 2-4% YoY compared to the average WTI price in Sep 2022 and approx.12%-14% increase YoY vs WTI Oil price average in December 2022.
If the current WTI oil price persists around this level (85-87 USD / bbl.) into the rest of 2023, then already starting in September US Energy commodity CPI component will turn from a negative -0.5% CPI contribution (at current CPI % weight level) back to a positive contribution of +0.1% by September and tick up further to +0.5% in December as the base effects from last year’s energy commodity prices will come down first in Sep but more steeply again in December.
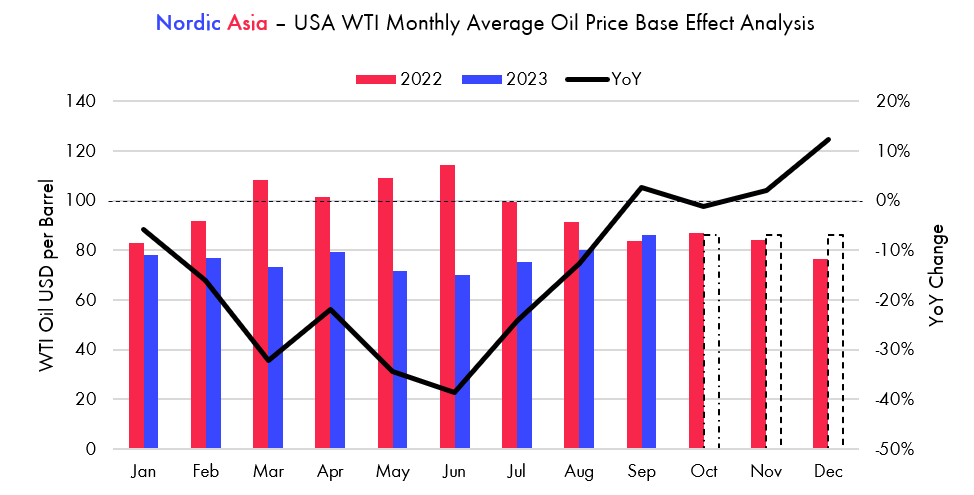
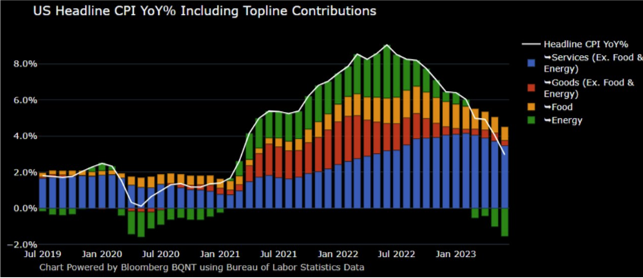
Therefore, as we have started to see a gradual pickup in the headline CPI since June 2023 – if oil prices remain at current trading levels or above throughout the remainder of this year then due to the declining base effects of commodity prices, the pickup in headline CPI is likely to accelerate, and the gap between headline CPI and core CPI to narrow further or even reverse again if WTI oil prices remain elevated. Recently, in our conversations with investors and strategists here in Hong Kong and Shanghai, quite frequently the common view is that global inflation has peaked and is on a continued downward path, pointing to the decline in core inflation. However, core inflation is the lagging part of the inflation subcomponent, while energy commodities (more volatile) tend to be the leading part of the inflation subcomponent. So if oil price remains at this level or above and after the August CPI print, it is likely that headline CPI will accelerate again, driven by energy commodities, but hopefully this will not lead to a new round of price / wage spiral that could push Core CPI up again.
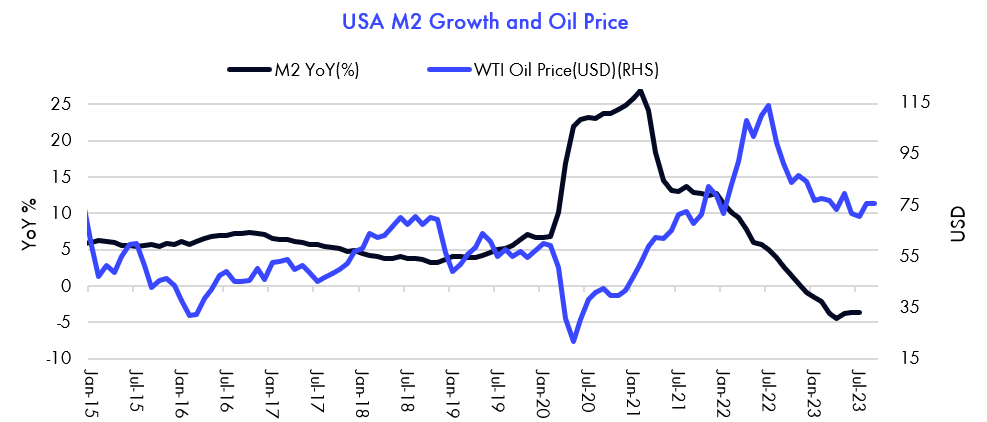
But, given the current economic slowdown, weaker PMI outlooks, global rate hikes, and accelerated increase of new energy vehicle transitions WTI oil prices still remain quite high. Therefore, looking into history, the chart below shows the relationship between the US M2 Growth rate and WTI Oil prices priced in USD. Although M2 growth has come down significantly since the start of this current rate hike cycle, the YoY growth rate % might not have come down enough to drive WTI oil prices down further.
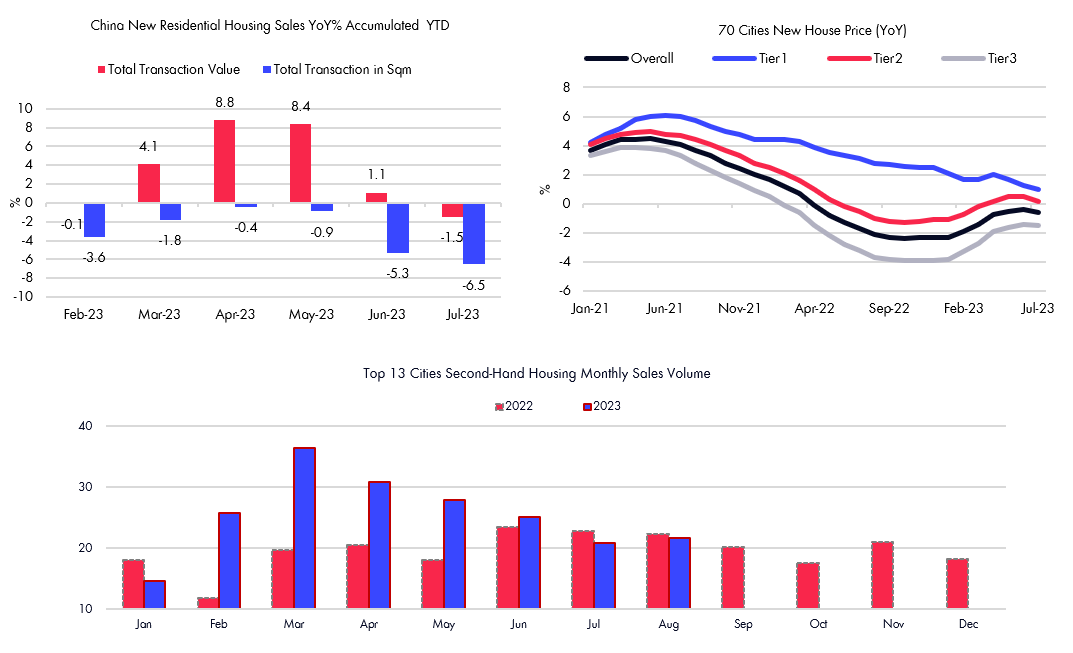
As we continue to navigate through a period of complex global macro and geopolitical environments, the development and market participants' views on the path of the aforementioned factors of inflation might enter a new phase, and if inflation overshoots again in H2 2023, it could cause greater market volatility during this fall. Domestically, during August, despite the clear messages and guidance from the politburo meeting in late July, real market transactions slowed down in general, of which new build residential sales declined to -6.5% sqm YTD July (from -1.5%) to a total of 665 million sqm while second-hand residential market sqm sales in top tier 13 cities reached +34% YTD Jul. Fixed asset investments from the residential real estate market continued to be a drag on the economy with a YTD decline of approx. -7.6%. and speculations around Country Gardens possible default became the headline news during August. On this topic, similar to Evergrand in 2021, some of these private developers, such as Country Garden with high leverage (Equity/Debt ratio at 20% and mainly rely on new build sales), have faced a combination of multiple headwinds, 1. Limited debt / financing growth 2. Decline of investment demand in residential segment 3. Growth of secondary housing market sales vs new construction sales. However, in terms of size Country Gardens, although it is among the top tier private developers its assets accounts for approx. 0.4% of total residential market value. Total real estate prices in China thus far in 2023 have remained quite flattish and came in at -0.6% YoY in July where prices in tier 1 / 2 cities remained more resilient than those of tier 3 and lower cities.
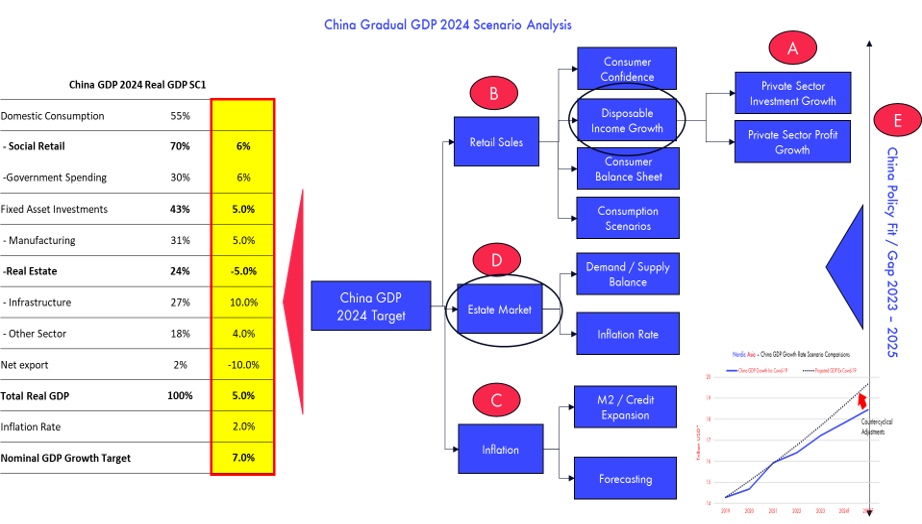
As we wrote and broke down more in depth in our previous newsletter, the Chinese economy can be divided into the key growth engines 1. Domestic Consumption (Private, Government) 2. Fixed Asset Investment (Manufacturing, Infrastructure, and Real Estate) and 3. Net exports. Now that COVID-19 has been lifted in 2023 the sector that has benefited the most has been private domestic consumption (which accounts for more than 2/3 of GDP growth), but so far in 2023, the other two segments of exports and the real estate sector have been a drag on the overall economy as compared to the pre-covid year of 2019. Therefore, as mentioned previously, if we exclude the low base effects from 2022, GDP in 2023 would reach an adjusted real growth rate of approximately 3.5% which is lower than the longer-term goal of 5% GDP and therefore more counter-cyclical measures is required to offset the current drag from the other two growth engines (Fixed asset investments and exports). From a policymaker's point of view, export demand is difficult to control, as it is affected by both export market demand and the geopolitical environment. However, within total China manufacturing, more than 60% of finished goods are driven by demand from its domestic market, while approx. 40% of total manufacturing is for the export market therefore some parts of the drop in export demand could be offset by an increase in domestic consumption demand.
However, when it comes to the real estate market, the GDP contribution part of the real estate market is mainly created by the process and investments of newly built residential apartments during the “construction phase”. However, driven by previous periods of combined effects of high urbanization rate growth and increased homeownership rates, it is not realistic to expect the same rate of continued new residential construction today than before (Top +1.700 million sqm). Furthermore, previously, the demand for new residential buildings came not only from fundamental demand but also from investment demand as the economy developed. But to cool off investment demand and the rapid raising of housing prices, the government introduced a series of restrictive purchasing measures, such as purchase restrictions in top tier cities and significantly higher mortgage down payment rates for second-time buyers, along with the three red lines to rein in debt growth and reduce the leverage among property developers in a capital-intensive industry.
Additionally, when looking into the composition of total transaction sales volume, new residential sales historically have accounted for more than 80% of total sq m transactions, while second-hand apartments account for around 20% - while this proportion is quite the inverse in more mature markets. Therefore, new residential sales will face more competition from the second-hand home market, as the proportion of the second-hand market is likely to continue. Therefore, the gradual moderation of new residential construction and new residential sales sqm from previous new construction peaks is to be expected, and the long-term growth of the residential new build sector should reflect the current fundamental housing demand of 1. Nr of newly graduated (one person apartments, approx. 40 sqm) 2. Nr of new marriages (average family of 3 apartments, approx. 100 – 120 sqm) 3. Urbanization 4. Increased second-hand market transactions. Therefore, although new residential build and new residential sales sqm is down this year, due to the aforementioned fundamental demand groups, price action on an overall level remained quite stable.
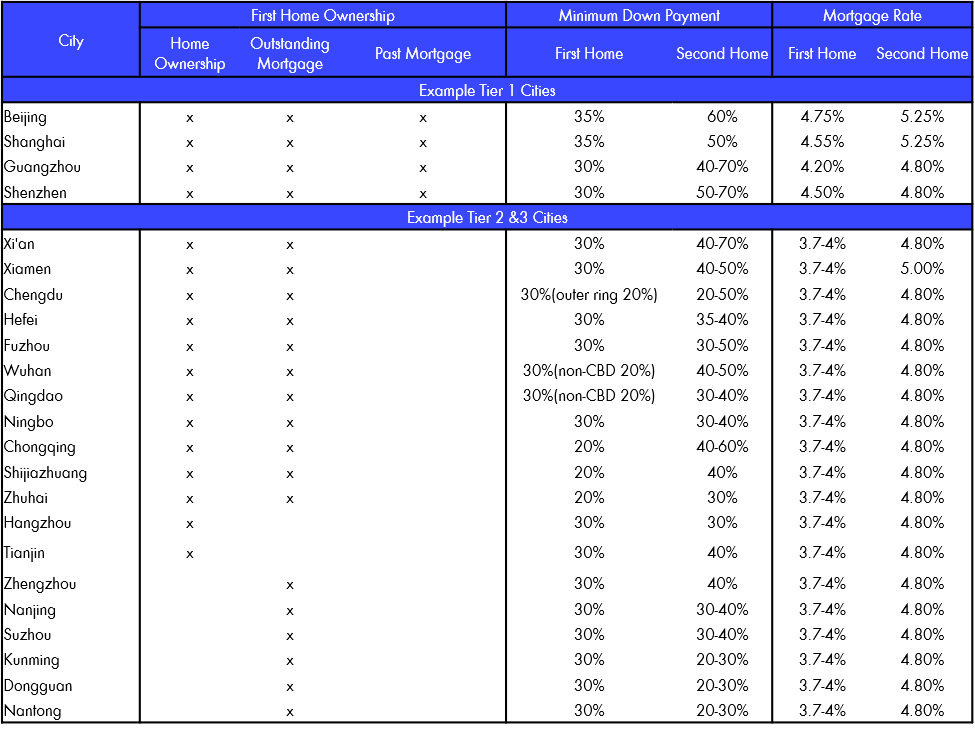
But at this moment, in order to achieve a pre-covid GDP trend growth rate of +5% or above , policymakers might need to stabiles new residential construction at least so that this sector is not a drag on the economy. Thereby, as per the guidance of the politburo meeting in July to optimize real market policies, two significant measures were finally introduced recently. 1. To allow existing mortgage holders to refinance existing mortgage rates from avg 5.1% rate down to current mortgage financing rate around 4.3% 2. Remove the history of previous mortgages (认房不认贷) to be classified as first-time buyers (to allow second time buyers the same down payment and mortgages as first-time buyers (for example Shanghai 35% downpayment for first time buyers, while the second time buyers down payment requirement is 50%). These two policies falls well in line with our consideration of counter-cyclical measures to lift the economy back to pre-covid growth rates.
I.e. via the reduction of existing mortgage rates by approx. 80 bps increase disposable income by a estimated range of 1.5% – 2.0% per annum. The second policy, which significantly reduces down payments for mortgage applicants for their second purchases, should drive up housing transactions, especially in top tier cities where pent-up demand for second purchases is more prevalent.
Since the policy was implemented, total transaction volumes in Beijing for new home sales in the first week of September already exceeded those of the entire month of August, and second hand house transactions sold more than half the volumes in August in the first week of Sep. Although it is early, and the refinancing of existing mortgage rates will only get started towards the end of September, additional policy measures could be needed to grow domestic demand to offset the drop in exports and to stabiles new residential construction investments. But the direction of the policy is at least one step in the right direction, and if real estate market transaction volumes continue to improve sequentially, this alone will provide ample confidence and further solidify the progress back to the long-term growth trend of 5% GDP in 2024.
Internally in Nordic Asia, based on our fundamental analysis, the incoming economic data globally and domestically is likely to continue in the trend as we have written about in our continuous newsletter updates. Therefore, despite some anticipated volatility due to global macroeconomic conditions this fall the domestic consumption market in China is in a different phase of the economic cycle, and the rollout of further policy measures since the politburo meeting in July is first proof of concrete counter-cyclical measures to improve domestic demand. Therefore, the trend of external slowdown but continued domestic market recovery is likely to continue in H2 2023 and 2024.. Looking into the results of our portfolio companies in H1 2023, since we’ve actively concentrated our portfolio towards more niche consumption brands and especially focused on service and retail parts of the economy to twelve core holdings with an average top line growth in H1 at +35% and operating profit growth outpacing revenue growth due to cost optimizations during Covid-19 years and positive operating leverage benefits. If Q3 China GDP is a good reflection of the current state of the economy (i.e. excluding Covid-19 base effects and before counter-cyclical policy measures kick in China) then moving into Q4 as both base effects come down again and recent counter-cyclical policy measures become noticeable, then Q3 China GDP might reflect the lower band of the Post-Covid-19 Ex base growth rate. However, due to fund flows and global market volatility in the short term this inflationary environment might still hamper price discovery, but as fundamentals and incoming economic data continue to improve, then we should see a gradual increase in attention to our niche market as well.
Thanks again for this and looking forward to discuss more in detail upon request
Best Regards
Yining, Jason and the NA Team 11th of Sep 2023
Jiumaojiu 1H23 result review
JMJ released 1H23 result with revenue at 2.9BCNY, +51.6% YoY while net profit came in at 222MCNY (7.7%) +285.2%. Main brand Tai Er recorded 2.2BCNY revenue in 1H23, +47% YoY, as seat turnover ratio recovered to 3.1x (vs. 2.9x in 1H22 or 3.7x in 1H21). New openings in 1H23 was 46 stores, with a target to open +120 stores for the full year 2023. ASP declined slightly to 75 CNY per order as the company released more discounts and set menus in H1 2023. The operating margin of Tai Er improved to 21.4%, vs. 16.5% in 1H22 or 23.5% in 1H21. Management guided normalized OPM for Tai Er should be around 23%. Another trending brand, Song Hot Pot Factory, came in stronger than expected with revenue at 352MCNY in 1H23, +331% YoY, thanks to 16 new stores opening and an improved seat turnover ratio at 2.8x (vs. 2.4x in 1H22). Similar to Tai Er, ASP also declined to 121CNY (130CNY in 1H22) to increase traffic and improve competitiveness. Song’s operating margin surprised on the upside and came in at 13.8%, vs. -1.4% in 1H22 or -22.9% in 1H21, ramping-up faster than expected. According to management, we should expect a 20% OPM for Song and in 3 years the nr of Song stores could ramp up from current 61 to +300 similar to the Tai Er brand store rollouts in previous years. Jiu Mao Jiu, the old brand, recorded 1H23 revenue at 317MCNY, +2% YoY with store number at 75. The company introduced a new store format that could enjoy similar store efficiency as Tai Er which help the bran hold up at the current size. Another brand under development is Lai Mei Li Grilled Fish is progressing well and could start its initial ramp up period in 2024. JMJ is in the recovery trajectory since the China reopening. However, Tai Er same store sales still have some gaps (87% same store sales) compared to 2019. But the recent new store openings are progressing well, and the roll-out of it new brands, Song, is progressing well above expectations and could enter a rapid phase of expansion in the years ahead.
Meituan 2Q23 result review
Meituan reported a beating result with 2Q23 revenue at 68.0BCNY, +33.4% YoY while adj. net profit at 7.7BCNY (NPM: 11.3%). Gross margin was 37.4%, +6.8ppts YoY thanks mainly to the rider cost cut in light of abundant rider supply. S&M expenses grew by 63.7% YoY in absolute amount, with S&M% increasing by 3.9ppts YoY due mainly to competition with Douyin in the local service segment. Meituan also managed to cut down R&D% and G&A% by 1.9ppts YoY and 1.2ppts YoY respectively, via operating leverage improvement and employees layoff. As a result, Adj. EBITDA reached 7.68BCNY with adj. EBITDA margin at 11.3% vs. 10.7% in 1Q23 or 7.5% in 2Q22. By segment, core local commerce recorded 51.2BCNY revenue in 2Q23, +39.2% YoY, slightly better than expectations. Operating margin was 21.8%, -0.7ppts YoY, also better than expectations, supported by more rider cost cuts in 2Q23 and maintaining operating margin for local services businesses despite new entrants. New initiatives segment was in-line with expectations, with 2Q23 revenue at 16.8BCNY, +18.4% YoY as both Meituan Grocery and Meituan Select decelerated amid offline consumption recovery. Operating loss came in at 5.2BCNY due to more user incentives and infrastructure investment in the summer. Management indicated that Meituan Select (a community group buying business) sales slowed in Q2 amid reopening and competition with Pinduoduo while Meituan Grocery continued to grow. Despite this, the total nr of transacting users of Meituan Select grew to 470 million, and although management agreed further adjustments in Meituan Select are needed, but this business line still helps the group to penetrate its user base towards the lower tier cities in China. Meituan is likely to continue to deliver strong earnings in 2023 as the food delivery business remains sticky, the rebound in local services, in-store hotel bookings is thriving so far (growth +59%) and the continued operating leverage and lower rider costs to further support profitability. Finally, as the “Alibaba” of services and the clear market leader in this segment, Meituan is poised to benefit from the continued increase in domestic service retail consumption ahead.
Robam Appliance 2Q23 result review
Robam enjoyed a rebound in 2Q23 due to a combination of lower base and increased total property transaction volumes (including second hand transactions). Robam’s 2Q23 revenue was 2.76BCNY, +16.9% YoY, in-line with the company’s guidance, while net profit at 441MCNY, +23.9% YoY. Meanwhile, Robam maintained its market leading position in 1H23. 2Q23 gross margin was 49.7%, improved by 2.7ppts YoY due to declining raw materials and stable pricing. S&M% increased to 25% in 2Q23, from 24.6% in 2Q22 due mainly to more advertisement and promotion for newer products. 2Q23 G&A% declined to 7.9% vs. 8.6% in 2Q22 thanks to operating leverage improvement. As a result, net margin improved by 0.9ppts to 16.0% as less impairment loss reversal in 2Q23 offset the G&A% optimization. Robam’s product group 1 (traditional categories) recorded revenue of 3.7BCNY in1H23, +11.7% YoY, supported by the developer channel and continued good housing completion rates from previous year. Product group 3 (newer categories) recorded 833MCNY revenue in 1H23, +24.3% YoY only, due to COVID disruption in 1Q23. The growth of product group 3 was more in-line in 2Q23 with ~50% YoY growth. Robam's role as a kitchen home appliances' supplier is highly correlated with the property transaction volumes of both first and second-hand property sales / renovation projects. China market is currently experiencing a transition from primary market into a secondary market as more policies is promoted to stabilize the sale of first hand residential transactions. Robam due to its diversified sales channels ( 40% E-commerce, 40% off-line retailers, and 20% projects) and premium brand positioning, has been able to further increase its market share in its core product segments. Therefore, despite a relative weak property transaction environment for first hand residential sales, Robam was still able to deliver a solid double-digit top line growth of +16.9% in Q2. Therefore, if total residential property sales start to rebound in Q4 from their current low base, we should see a meaningful market rebound for Robam at current levels.
Disclaimer
This e-mail is for marketing purposes only and does not constitute financial advice to buy or sell any financial instrument. This e-mail and the documents within may not be distributed further and is only for people and companies' resident in the European Union, the EES and Switzerland. This e-mail is therefore not intended for any person or company resident in the United States, Canada, Japan or Australia or in any other country in which the publication of this material is forbidden. If the laws and regulations is as described above, the reader is then prohibited to take part of this –mail. In accessing this e-mail the reader confirms that he or she is aware of the circumstances and requirements that exist in respect of accessing this e-mail and that these have not been violated. Nordic Asia disclaims any responsibility for any typos and do not guarantee the validity in the information and documents in this mail including typos, corrupt e-mails and/or for actions taken as a result of the mail and/or the documents within. All investments is always attached to a risk and every decision is taken independently and on their own responsibility. The information is this mail is not intended to be used instead of the professional financial advises as the individual receiver might need. There is no guarantees that the Company will fulfil its obligations under the loan financing which is referred to in this e-mail. Any funds invested may be lost.