

Nordic Asia Investment Group - Newsletter November 2024
**Growth momentum continued in Nov with next key policy meeting on 11-12th of December **
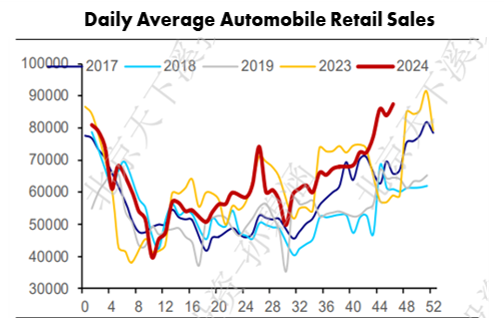
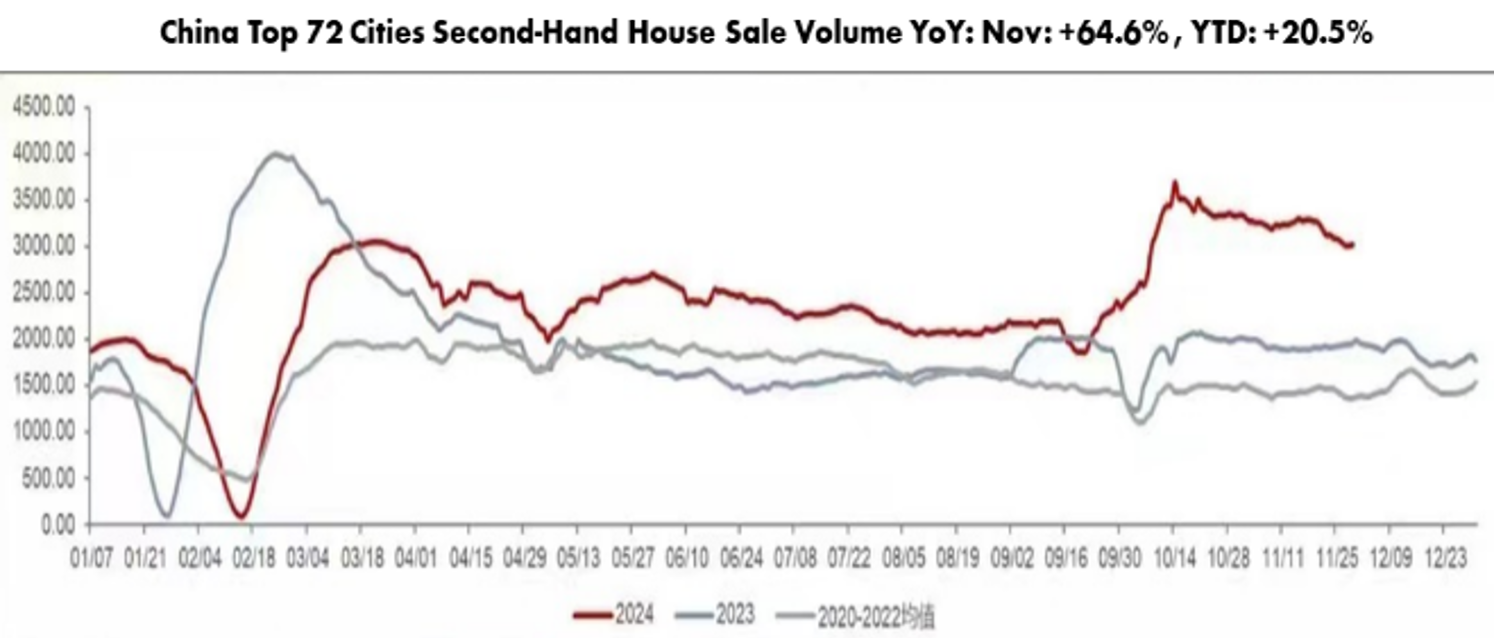
Data confirmed economic growth in Nov: Real Estate sector (+65% Second-hand estate sales volumes and +11% new residential sales in Nov. Passenger car retail sales+18% in Nov while EV sales grew +52% as penetration of EV stood for more than 50% of total car sales. Next policy meeting 11-12th of Dec to provide guidance on economic priorities and fiscal support for 2025.
Global Macro
As the market is starting to move beyond the focus and recent “Trump-trade” post-election results, US stocks have continued to outperform. But beneath the strong price movements, it is noteworthy to also follow up on its opposite polarity of its recent strong price performance. This can be highlighted from an example of the following measures: First, the due to the price performance of the S&P 500 current earnings yield at 3.7% – 3.8% is below that of its current bond or cash yields of 4.0% - 4.5% . Secondly, the current market cap to GDP ratio (the Buffet indicator) is at an all-time high at +207.8%.
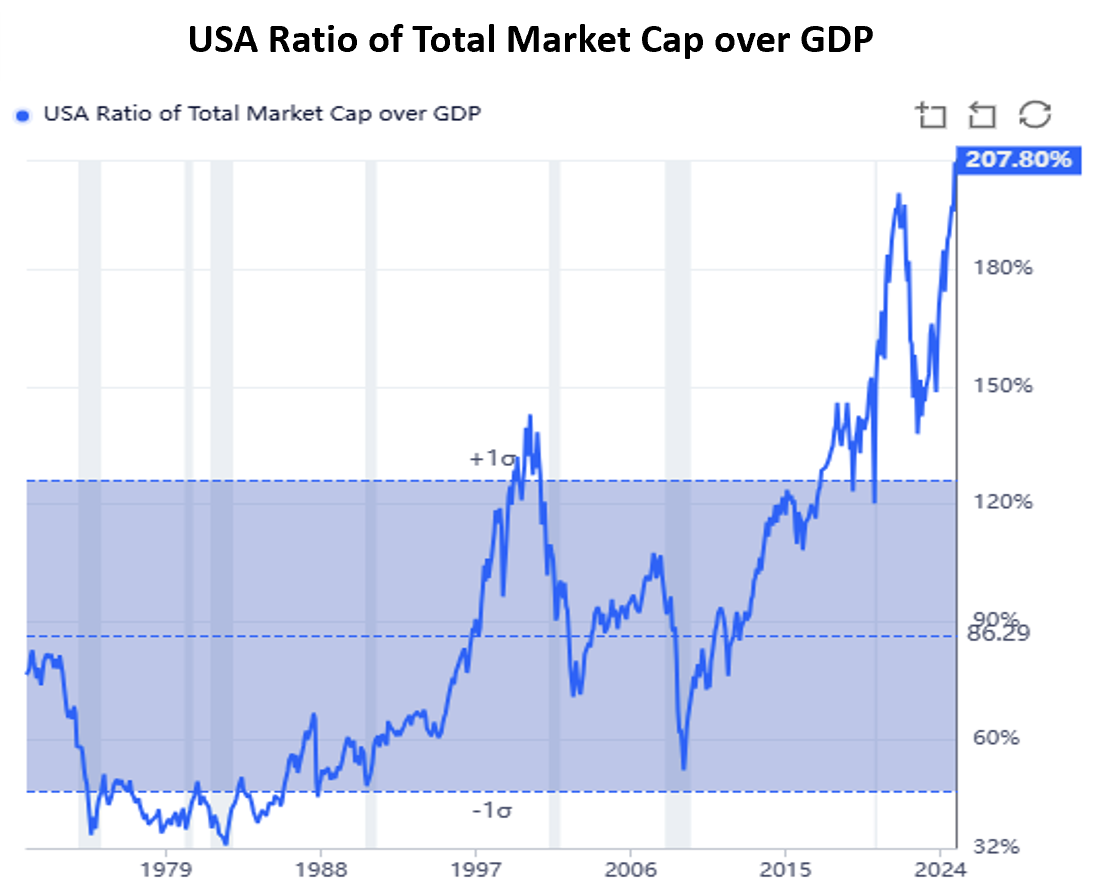
As a result of the strong performance of US equities above, the relative price performance of US equities vs rest of world is at all time high according to the below:
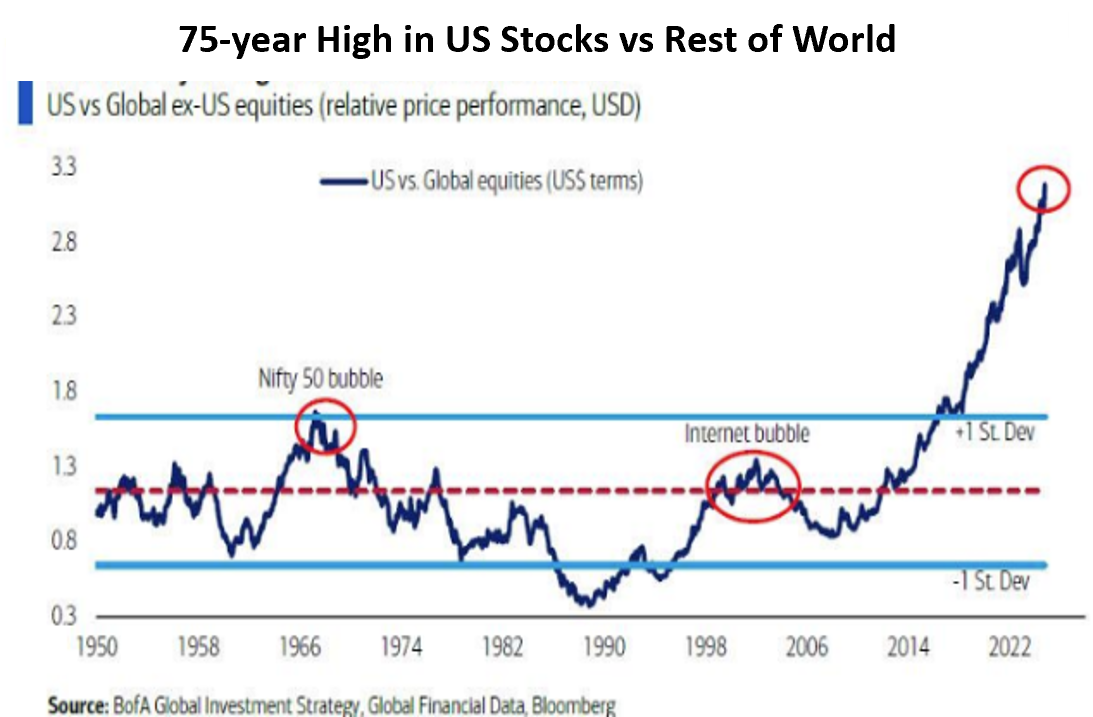
Of course, there are many factors in favor of the observed price performance and economic fundamentals, but it is also important to keep notice of the opposite polarities of the strong price performance such as the above as well.
Finally, as we move into 2025, base effects from oil and goods will continue to decline while rent and services inflation has remained sticky and continued up recently. Furthermore, Trump's key policies of tax reductions, tariffs, immigration and continued on shoring might also add to further inflationary pressure. Thereby, the focal point of the global markets might revert to the subtle changes in the inflationary outlook ahead to 2025. As the path down to a sustained 2% inflation level might still take a couple more twists and turns in the new year ahead.
China Macro
Since the first part of the stimulus package in Sep, we’ve continued to see a continuation of economic improvements during the month of Nov.
On the real estate market China housing sales sustained high levels in Nov since the 24th of Sep, especially in top cities, signaling relatively robust housing demand.
In terms of new house sales, sales from the top 50 cities continued to increase +11.1% YoY while Second-hand house sales continued strong at +64.6% for Nov (YoY) and now +20.5% on YTD basis. Prices continued to stabilize with support of the increased transaction volumes, especially in higher-tier cities.
Within the retail sector we can also see the improved figures for the month of Nov where home appliances sales grew by approx. +40% YoY and retail of consumer electronics grew by 28%, as these two categories were beneficiaries of the double 11 shopping festival in November and supported by previously announced the trade-in program.
Finally, retail sales of passenger cars remained high at +18 as both supported by the trade in policy, new EV model launches, and periodic lower base from last year. EV sales in the month of November grew by +52% and stood for more than +50% of total car sales volume in November.
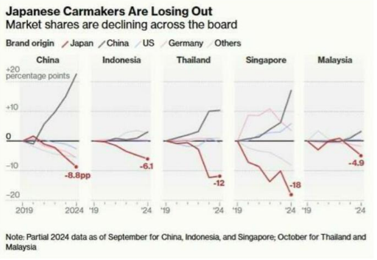
We recently met with BYD and Geely here in Hong Kong. The EV sector is continuing to boom in China as penetration rates increase, scale growth and prices for lithium-ion batteries continue to decline. Currently, China has emerged as the Nr 1 exporter of cars and now exports more than +5.7 million vehicles per year, taking market share globally, for example, in Southeast Asia:
Due to the intense domestic competition, BYD and Geely who are mainly focused on the mass-market price range of 100.000 – 150.000 CNY continue to release new BEV models such as Geely’s Galaxy Series E5 which sold well and more than +50.000 units since Aug 2024 in China. The competitiveness and price ranges for these EV products are quite impressive and will be difficult to catch up from thier Western or Japanese peers as these companies continue to gain scale advantage in the EV sector due to its vast domestic market size.
Based on the above and possible front loading of export orders private manufacturing sector PMI number in Nov at 51.5 (50.3 Oct) and theservice PMI came in at 51.5 (52 Oct, (more holidays in Oct). Thereby continued to show progress and pick up in activity since the stimulus measures announced earlier in Sep and parts in Nov.
Looking forward, all eyes will now be focused on the Central Economic Work Conference next week which could provide clarity on the next steps of the fiscal stimulus and budget deficit targets size and scope for 2025. We expect more combined measures to be rolled out to lift inflation back to 2-3% from now until March 2025.
Thereby, the central economic work meeting next week should be an additional stepping stone towards this target and follow up on the guidance given earlier at the press briefing on the 8th of November. An increase in the fiscal deficit for 2025 between 3.5% - 4.5% is a reasonable range of current economist expectations.
Finally, from recent months’ Q3 reports and company meetings, retail of goods came in slightly weaker as expected (except for passenger car sales and especially EV sales), while services consumption outperformed. However, retail of goods picked up during the start of Q4 post the stimulus announced in Sep while service consumption remained steady despite seasonality effects in Q4. In the portfolio companies, profitability improved and reinvestment in business development and expansion continued during the quarter. Management were also more upbeat regarding the preliminary outlook for next year, given the recent policy announcement and internal business development progress thus far this year.
Looking into 2025, the policy shift has already occurred this September, with the intention of lifting nominal GDP for next year. Behind this, the leading companies within the consumption sector have strengthened their market position and further optimized their cost structures. Thereby, earnings growth potential might be underestimated due to operational leverage and positive price effects going into next year. Therefore, if policy follows now until March 2025, then we should soon start to see a cycle of gradual earnings upward revisions ahead to 2025.
Tencent Q3 2024
Tencent released an in-line 3Q24 result with revenue at 167BCNY, +8.1% YoY thanks to strong advertising and game revenue, but partly offset by weak fintech, similar to 2Q24. Adj. net profit was 59.8BCNY, +33.2% YoY thanks mainly to profit growth of minority owned companies as well as lower withholding tax provisions. GPM improvement continued from 49.5% in 3Q23 to 53.1% 3Q24 driven by a continued shift toward higher margin domestic games, video accounts, Weixin Search and improved profitability of the cloud. OpEx ratio was 23% increased by 0.9ppts YoY as S&M% increased by 0.5ppts on new game launches (DNFM and Delta Force) while G&A% increased by 0.3ppts YoY on increased staff costs and performance-based awards.
Game revenue 51.8BCNY +12.6 YoY, accelerated from +9% YoY in 2Q24, which was in-line with expectations given the accelerating growth of grossing. Domestic game revenue 37.3BCNY, +14.1% YoY, while International game revenue at 14.5BCNY, +9% YoY. LTM domestic grossing was +21% YoY domestical and +25.8% YoY oversea. Online ads revenue was 30.0BCNY +16.6% YoY in 3Q24 vs. 19.5% YoY growth in 2Q24. Revenue from video account marketing services +60% YoY on more ad load.
Tencent’s 3Q24 result was solid with a positive 4Q24 outlook: 1) Stable gaming revenue, 2) Continued growth and monetization of online ads 3) recovering fintech (from Oct). Growth of advertising will be strong due to the ad load of Tencents video accounts and is expected to re-accelerate if we see the macro improvement in the coming quarters.
Trip.com Q3 2024
Trip.com released a beating 3Q24 result for the 5th consecutive quarters. 3Q24 net revenue was 15.9BCNY, +15.5% YoY or +24.3% QoQ, thanks to resilient domestic tourist demand, continued strong outbound and overseas expansion, and growth of advertising and financial services. Adj. net profit was 6.0BCNY in 3Q24, +21.8% YoY thanks again to 558MCNY equity income. Adj. EBITDAM was 35.8% in 3Q24, +2.2ppts YoY, driven by operating efficiency improvement that was partly offset by the pre-guided increase of S&M spending (better expectation). R&D% was 21.5%, -2.8ppts YoY, despite to the AI investment that is in-line with management’s comment of minimal impact on financials. S&M% was 21.1% of revenue in 3Q24 +1.3ppts YoY, due mainly to global expansion marketing.
Accommodation revenue was 6.8BCNY, +21.7% YoY, thanks to robust growth in both outbound and domestic travel. Outbound hotel reservations recovered to 120%+ of 2019 level that surpassing the industry recovery of ~80%. Ticketing revenue was 5.65BCNY, +5.3% YoY as Outbound air booking also recovered to 120%+ of 2019 level while more long-haul travel. More low-tier citizens chose outbound travel with T4 +100% and T5 +300% during National Days holiday. Overseas OTA revenue grew by 60%+ YoY in 3Q24 with sustained momentum from 2Q24 (+70%+ YoY).
Trip.com maintained its strong momentum backed by outbound and oversea expansion, which offsets domestic tourism single-digit growth. We maintain our favor to Trip.com’s continued outperformance over the industry, supported by global exposure. Continued international momentum is also expected. We also see a persisted margin improvement outlook driven by operating efficiency gain via AI adoption and further outbound growth for TCOM.
Ke Holding (BEKE) Q3 2024
BEKE released 3Q24 result with revenue at 22.6BCNY, +26.8% YoY while adj. net profit at 1.8BCNY (7.9%NPM), vs. 1.16BCNY (6.5% NPM) in 3Q23. GPM was 22.7% in 3Q24 vs. 27.4% in 3Q23 as both contribution and margin of the higher margin existing home (EH) segment declined, partly offset by strong growth in the new home (NH) segment. R&D was 526MCNY, +24.4% YoY or as 2.3% of total revenue, -0.1ppts YoY. S&M was +19.1% YoY or 8.3% of total revenue, +0.6ppts YoY, as BEKE continued ramp-up of its S&M support to home renovation segment and increased expenses for BD of new connected stores. G&A was +19.1% YoY, or 6.8% of revenue, flattish YoY. Adj. EBITDA margin hence at 9.5% in 3Q24, -4.6ppts YoY. BEKE launched new rounds of agent acquisition along with store expansion since 2Q24 due to possibly front-load of policy adjustments. The number of stores and agents was +12.1% and 11.0% YoY respectively, which increased fixed costs and dragged margins.
EH GTV was +8.8% YoY and continued to gain market share. BEKE indicated that 3Q24 EH online signing in T1 cities was +21% YoY vs. BEKE platform’s +44% YoY. However, EH revenue was 6.2BCNY, -1.4% YoY, which is slower than GTV due mainly to take rate drag from higher contribution of GTV by non-Lianjia stores. Take rate hence declined by 0.14ppts YoY to 1.30%。NH revenue was +30.9% YoY while GTV +18.5% YoY (market -16.3% YoY). Take rate further increased both YoY and QoQ to 3.39% which further demonstrated BEKE’s strengthening capability in NH business. Home renovation revenue +32.6% YoY, as efforts continued to optimize its sales and delivery model. BEKE once again demonstrated its alpha with a more optimistic outlook supported by policy tailwind since Sept.-2024 and a major beneficiary of the recovery in the Chinese real-estate market.
Geely Auto Q3 2024
Geely delivered an in-line 3Q24 result with revenue at 60.4BCNY, +20% YoY while sales volume at 0.53mn, +19% YoY, indicating ASP increase (111KCNY/unit in 3Q24) for the 3rd consecutive quarters. Net profit was at 2.76BCNY (deducting one-off), +116% YoY, vs. 2.5BCNY expectation. GPM improved to 15.6% (+0.5ppts YoY), S&M% declined to 4.5% (-0.9ppts YoY) while G&A% declined to 5.8% (-1.2ppts YoY).
Geely brand sales volume at 0.41mn, +15.5% YoY with the ICE models, China Star (中国星) series, +25% YoY. Galaxy series volume was 72K in 3Q24, +91% YoY. Galaxy E5, the newly launched BEV model with outstanding value that pricing at ~100KCNY, recorded sales delivery exceeding 50K in 100 days. The Galaxy E5 was also the very first profitable BEV model that was launched by non-BYD manufacturer while also sold at low price.
We also see a strong Zeekr result that with revenue at 53.1BCNY, +51% YoY, GPM improved to 15.2%. Zeekr’s sales volume was +51% YoY. Lynk & Co was slightly weaker with sales volume +18% YoY. The full-year target of 2mn volume was completed at 86% by Oct-24.
The company also announced consolidation of Lynk & Co. to solve the internal cannibalism issue. The M&A will be completed in 1H25 which will improve the overall efficiency. Geely Auto will control 81% of Lynk & Co. post consolidation, vs. 50% prior to transaction.
Geely is expected to achieve its full year sales volume growth via the launch of its highly competitive new NEV models. Profit growth from NEV is likely to accelerate further as Geely it continues to roll out new models next year within the Galaxy series to target the mass market EV price range of 100.000 – 150.000 CNY.
Disclaimer
This e-mail is for marketing purposes only and does not constitute financial advice to buy or sell any financial instrument. This e-mail and the documents within may not be distributed further and is only for people and companies' resident in the European Union, the EES and Switzerland. This e-mail is therefore not intended for any person or company resident in the United States, Canada, Japan or Australia or in any other country in which the publication of this material is forbidden. If the laws and regulations is as described above, the reader is then prohibited to take part of this –mail. In accessing this e-mail the reader confirms that he or she is aware of the circumstances and requirements that exist in respect of accessing this e-mail and that these have not been violated. Nordic Asia disclaims any responsibility for any typos and do not guarantee the validity in the information and documents in this mail including typos, corrupt e-mails and/or for actions taken as a result of the mail and/or the documents within. All investments is always attached to a risk and every decision is taken independently and on their own responsibility. The information is this mail is not intended to be used instead of the professional financial advises as the individual receiver might need. There is no guarantees that the Company will fulfil its obligations under the loan financing which is referred to in this e-mail. Any funds invested may be lost.